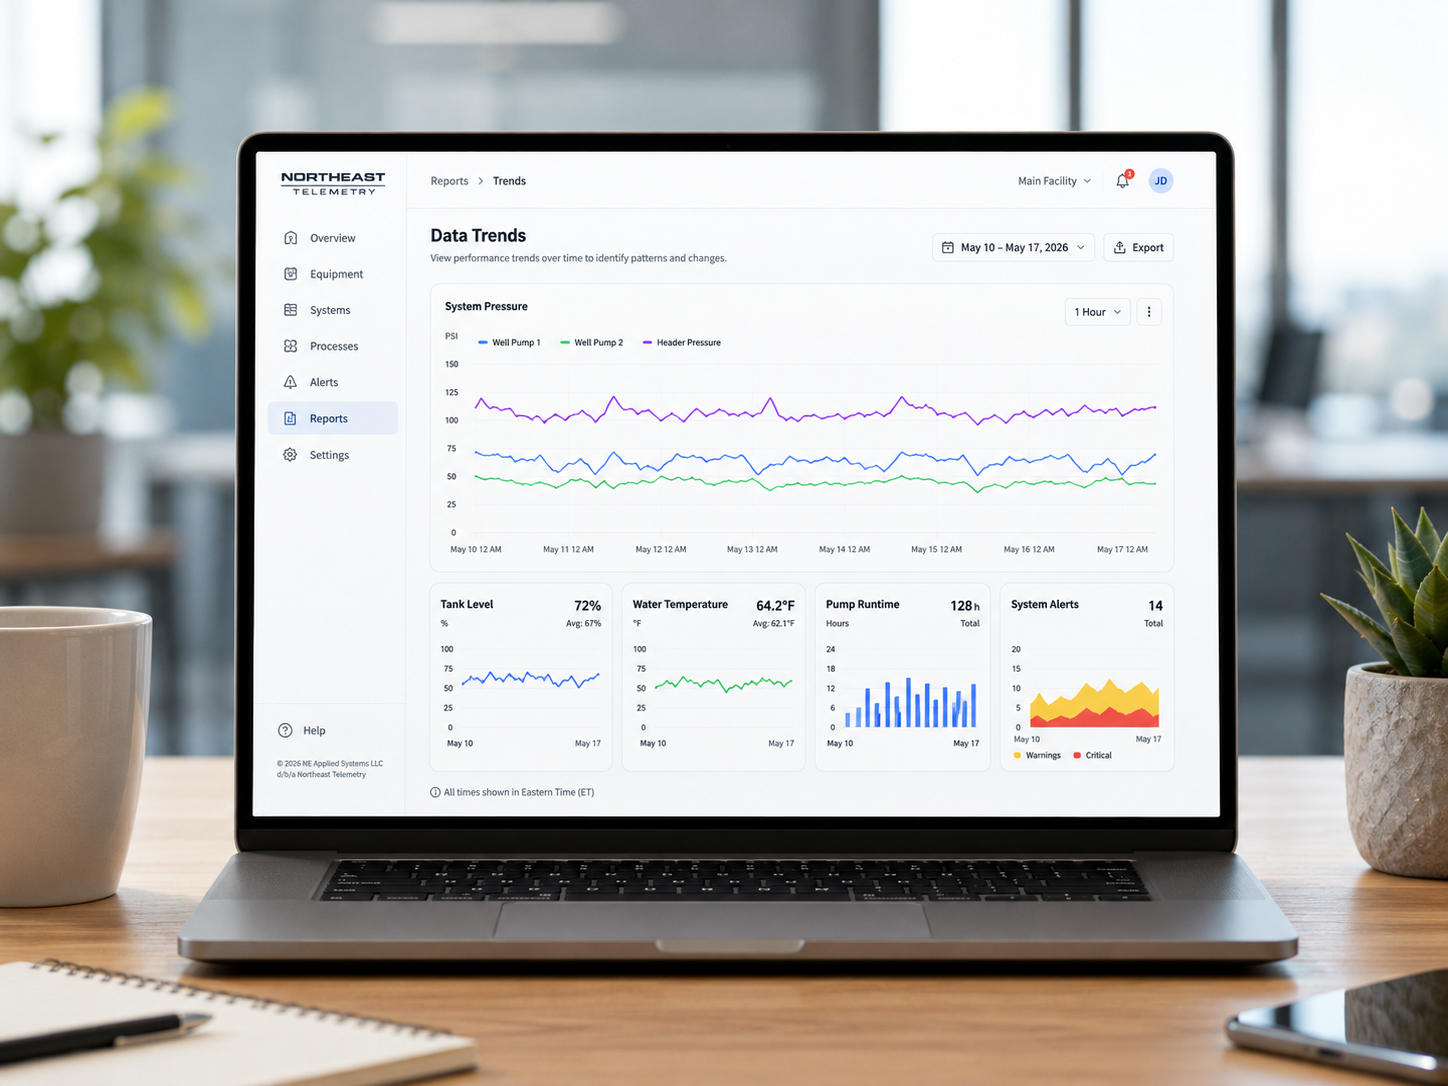
Trend View
See patterns over time, such as rising pressure, repeated runtime cycles, temperature changes, or usage spikes.
Example Views
Examples of how equipment, connected systems, and daily processes can become clear visual data.
Three common formats for quick decisions.
See patterns over time, such as rising pressure, repeated runtime cycles, temperature changes, or usage spikes.
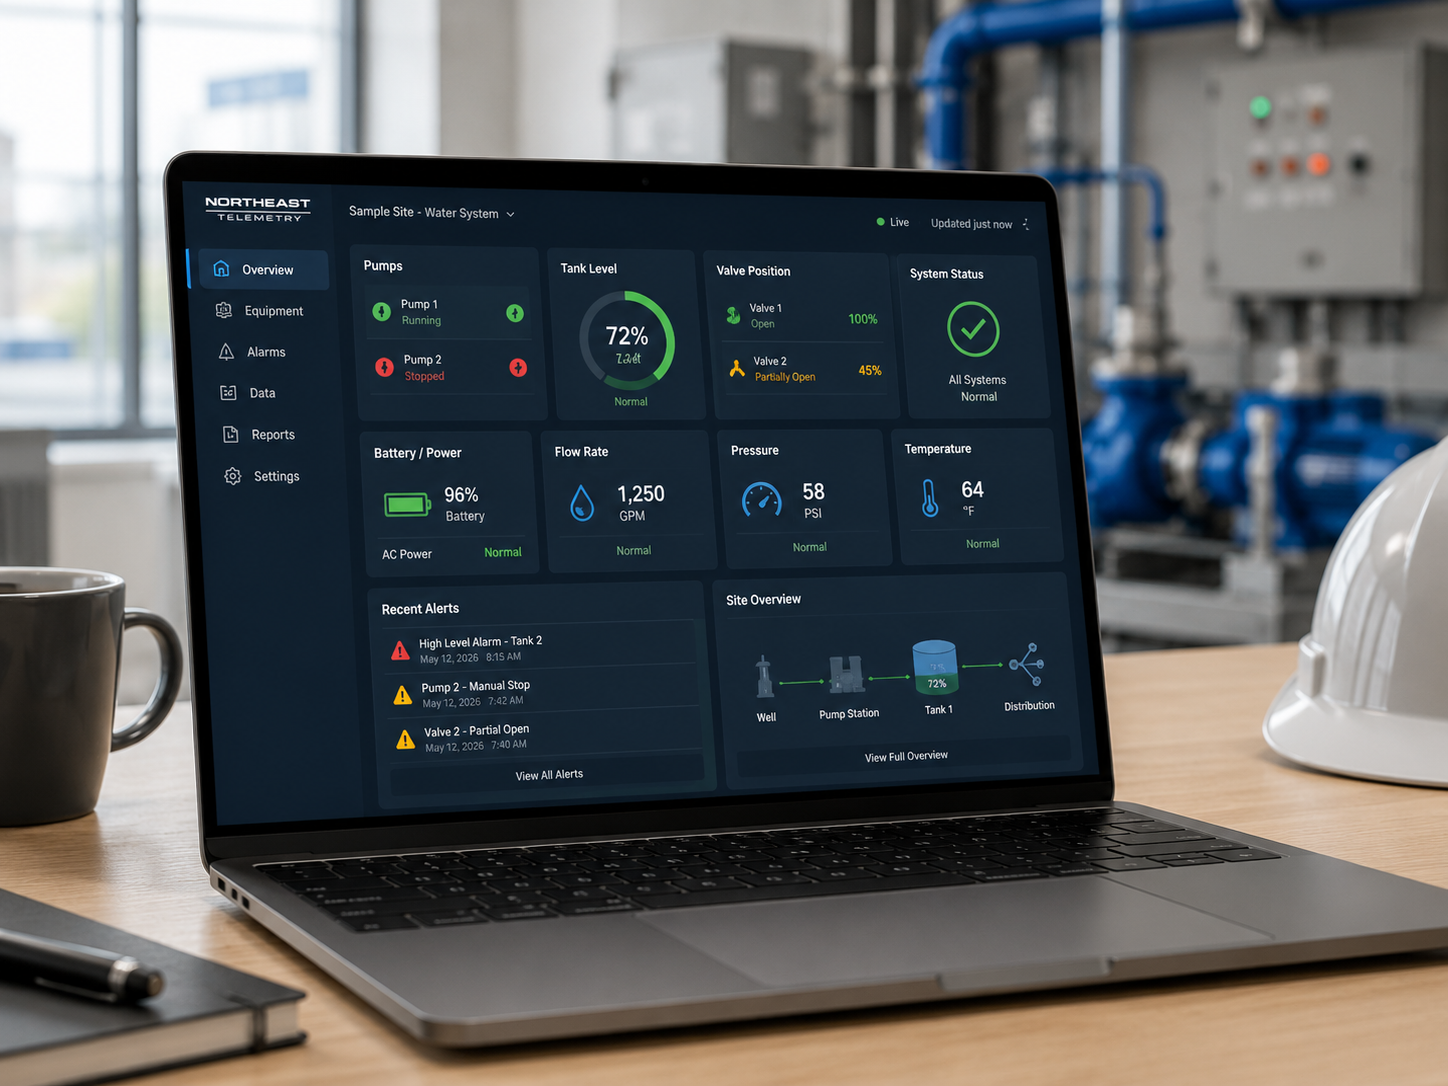
See current conditions in one place, including normal states, warnings, alerts, and recent activity.
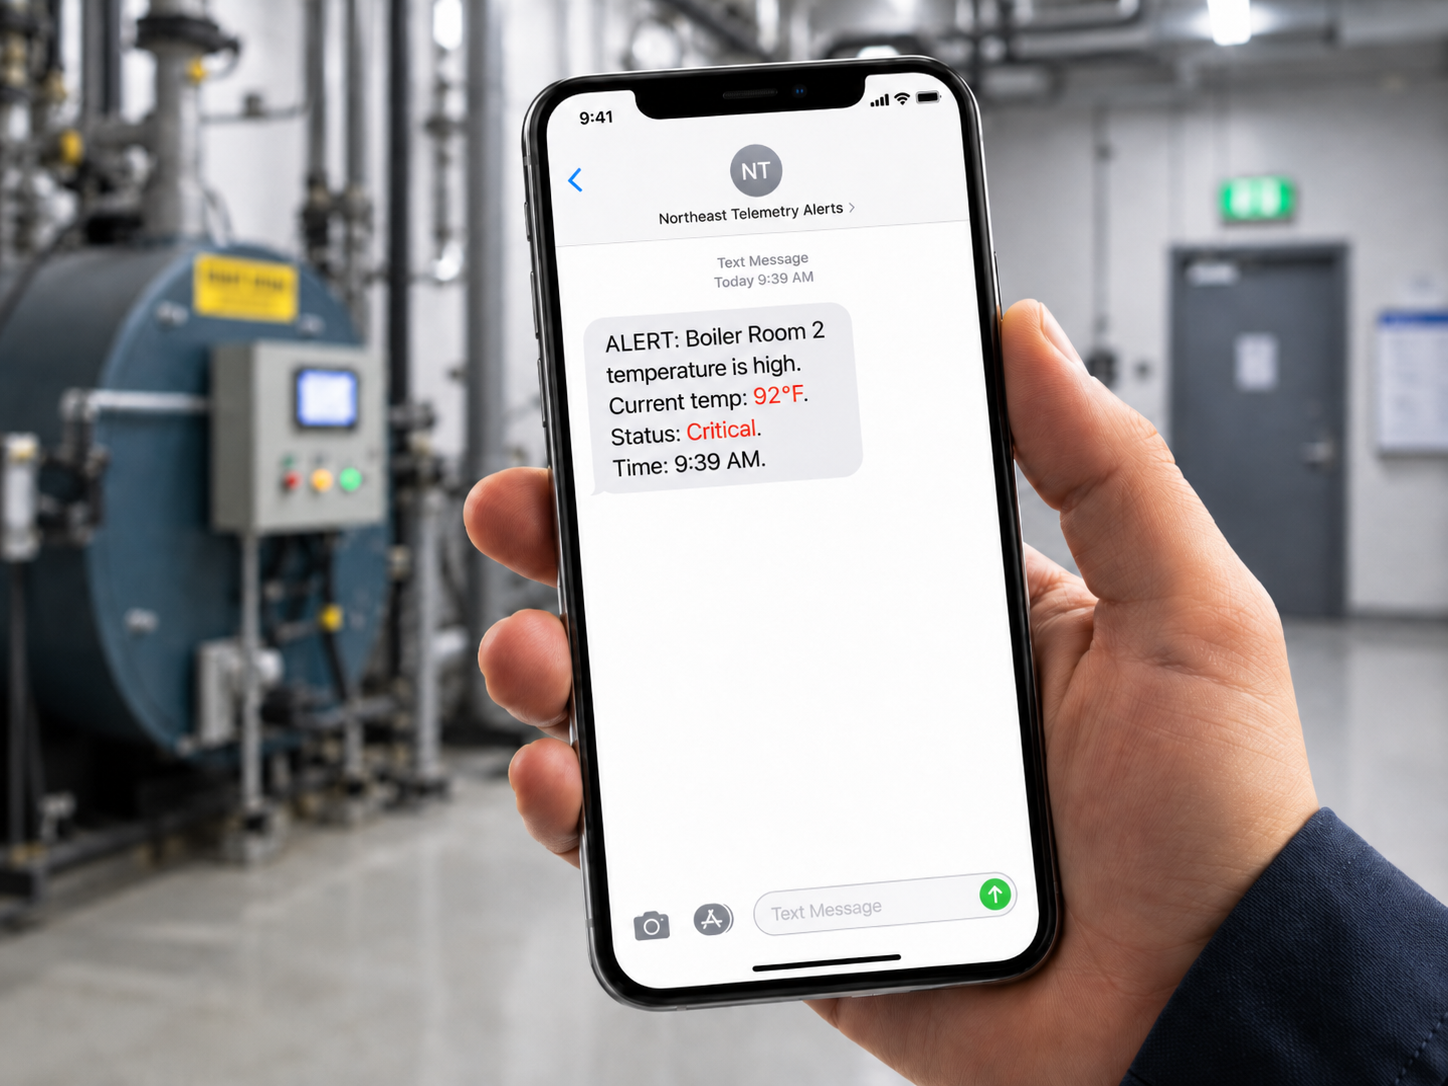
See alerts when a sensor crosses a threshold, a system changes state, or something needs attention right away.
Monitoring Planner
Describe your property, equipment, system, or process and we’ll help organize the next step.